
Meb Faber's All-Time High Switch
Buying Near All-Time Highs: A Bad Idea or a Brilliant Move?

“Buy Low, Sell High” — a classic mantra that sounds simple but can be nearly impossible to consistently pull off. So, what if instead of waiting for rock-bottom prices, you bought near all-time highs? Feels counterintuitive, right? But sometimes, our gut instincts can lead us astray. Let’s dive into this unconventional strategy that I picked up from an AllocateSmartly article and originally shared by Meb Faber (pdf), and put it to the test with QuantMage to see if it actually holds up.

🚨 Quick reminder: What you’re reading here is just for your information. It’s not investment advice or a suggestion to buy or sell anything. Always do your own research, and consider consulting a financial advisor before making any moves.
The All-Time High Switch with Dynamic Bonds
Here’s the gist: the strategy goes “risk-on” when an asset’s current price is within 5% of its all-time high. AllocateSmartly uses a 12-month high version, but I’m sticking with the original. This approach includes five risk assets — SPY, EFA, VNQ, GLD, and DBC — covering U.S. equities, international equities, U.S. real estate, gold, and commodities. When the signal for any asset is “off,” it shifts into IEF, a 7–10 year Treasury bond ETF. Given the recent struggles of long-duration bonds, AllocateSmartly suggests a Dynamic Bond approach: if bonds are faltering according to the same momentum check, they move to a cash-like asset (BIL in this case).

This logic repeats for each asset, and they all get equal allocation. Unlike the articles, I’ve opted for a 10% threshold rebalancing instead of monthly rebalancing. I believe this tweak adds a bit of robustness, as long as you can automate the execution.
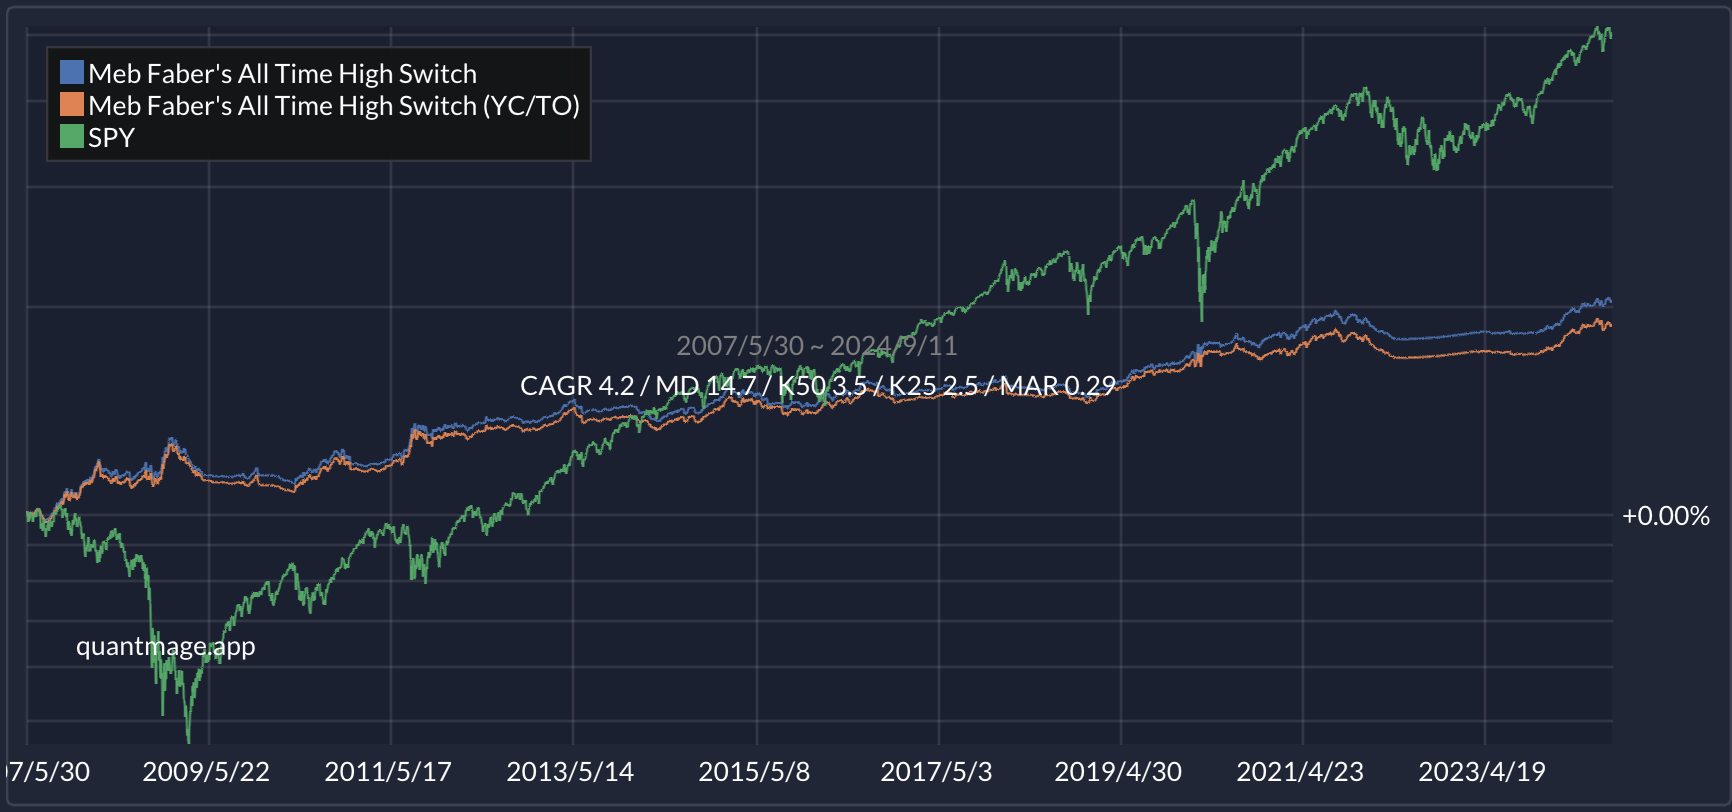
The result? A compound annual growth rate (CAGR) of 4.2% and a max drawdown (MD) of 14.7% over a 17-year period. At first glance, these numbers might not seem to match up with the stats mentioned in the articles. But if you take a closer look, you’ll notice it also reflects a meaningfully lower performance for the comparable period:


That said, this strategy does outperform a simple SPY buy-and-hold in terms of risk-adjusted return (Sharpe ratio of 0.75 vs. 0.57). But let’s be honest: 4.2% CAGR isn’t exactly setting the world on fire, especially when you can find some banks offering 5%+ interest these days. So, how do we make it more exciting?
The Less Dull Version
After a bit of tinkering, I came up with this twist: loosen the all-time high threshold to 15% to increase market participation and make the signals more reliable by confirming them over 10 consecutive days.
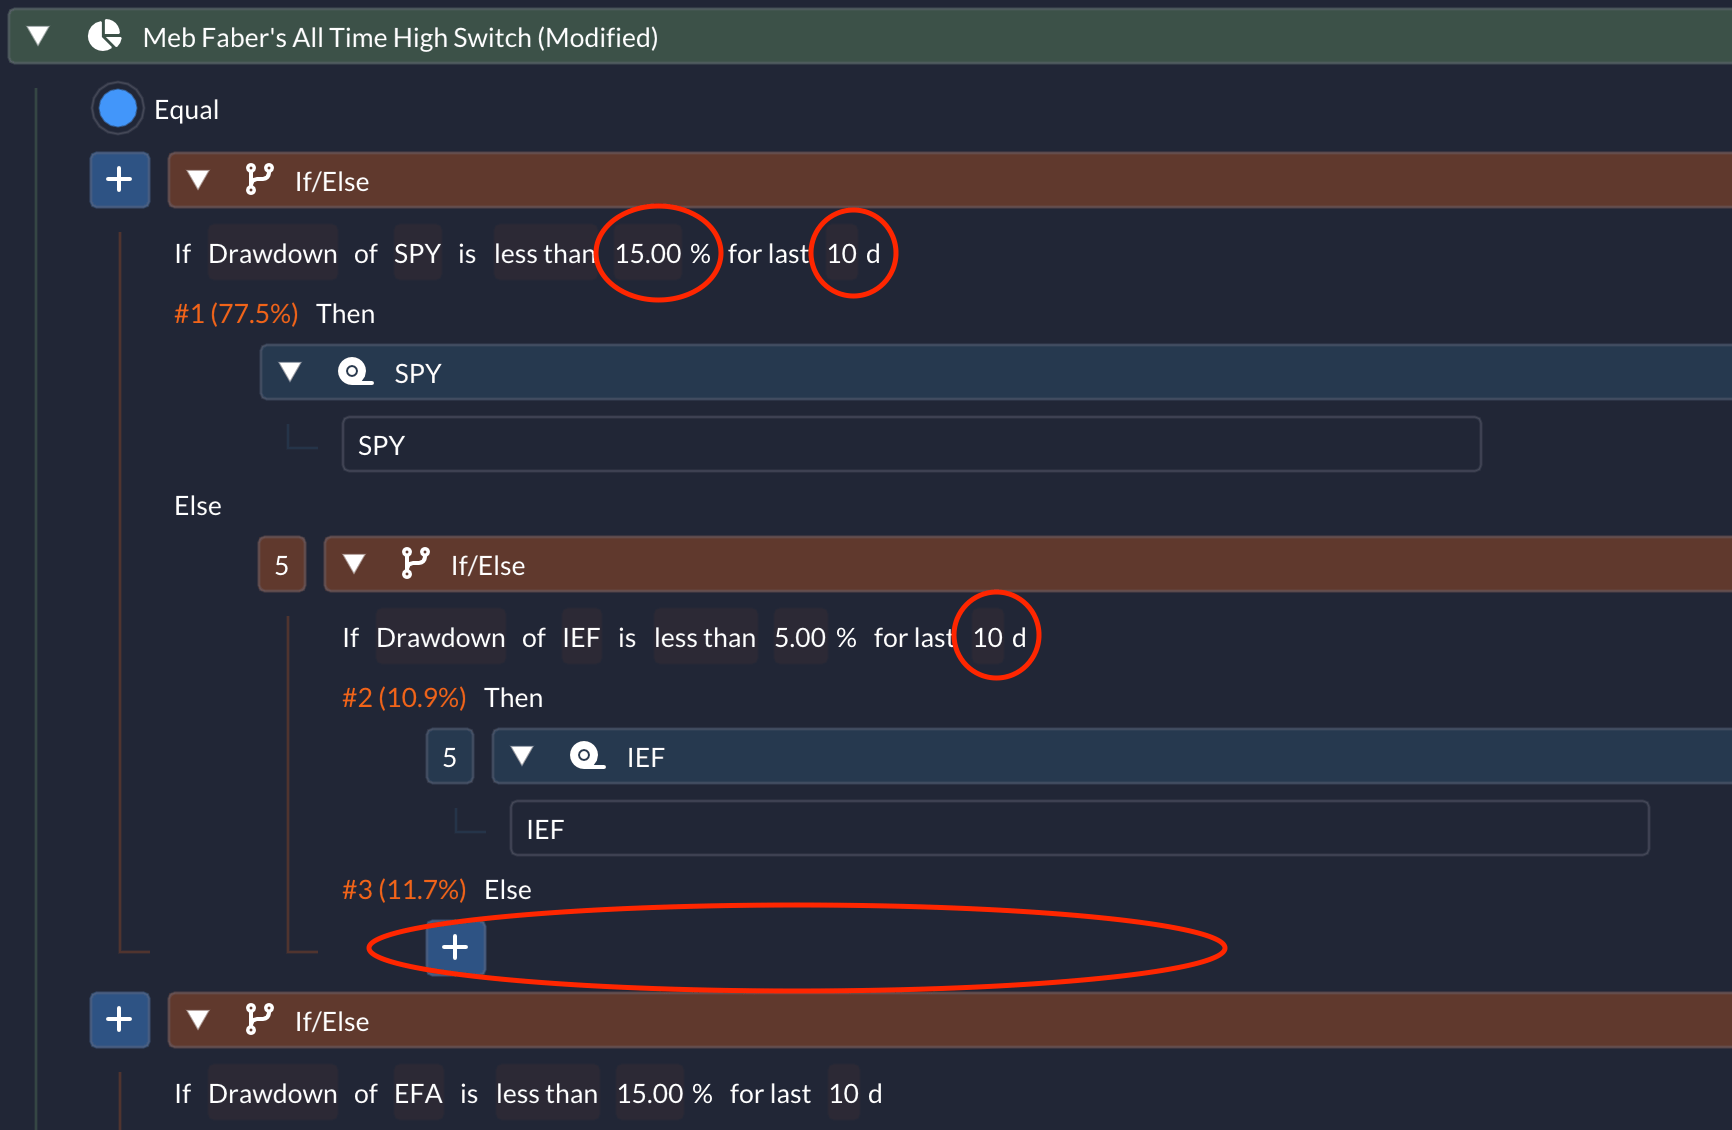
Another critical change? Instead of escaping to BIL (a cash-like asset) when the signals are off, we move to an “empty branch.” In a Weighted block, this behaves differently as explained here. Instead of going to cash, the remaining assets are re-weighted proportionally. So, if one of the five blocks moves to an empty branch, the other four each get 25% weight instead of 20%. Think of it as a way to maximize market participation.
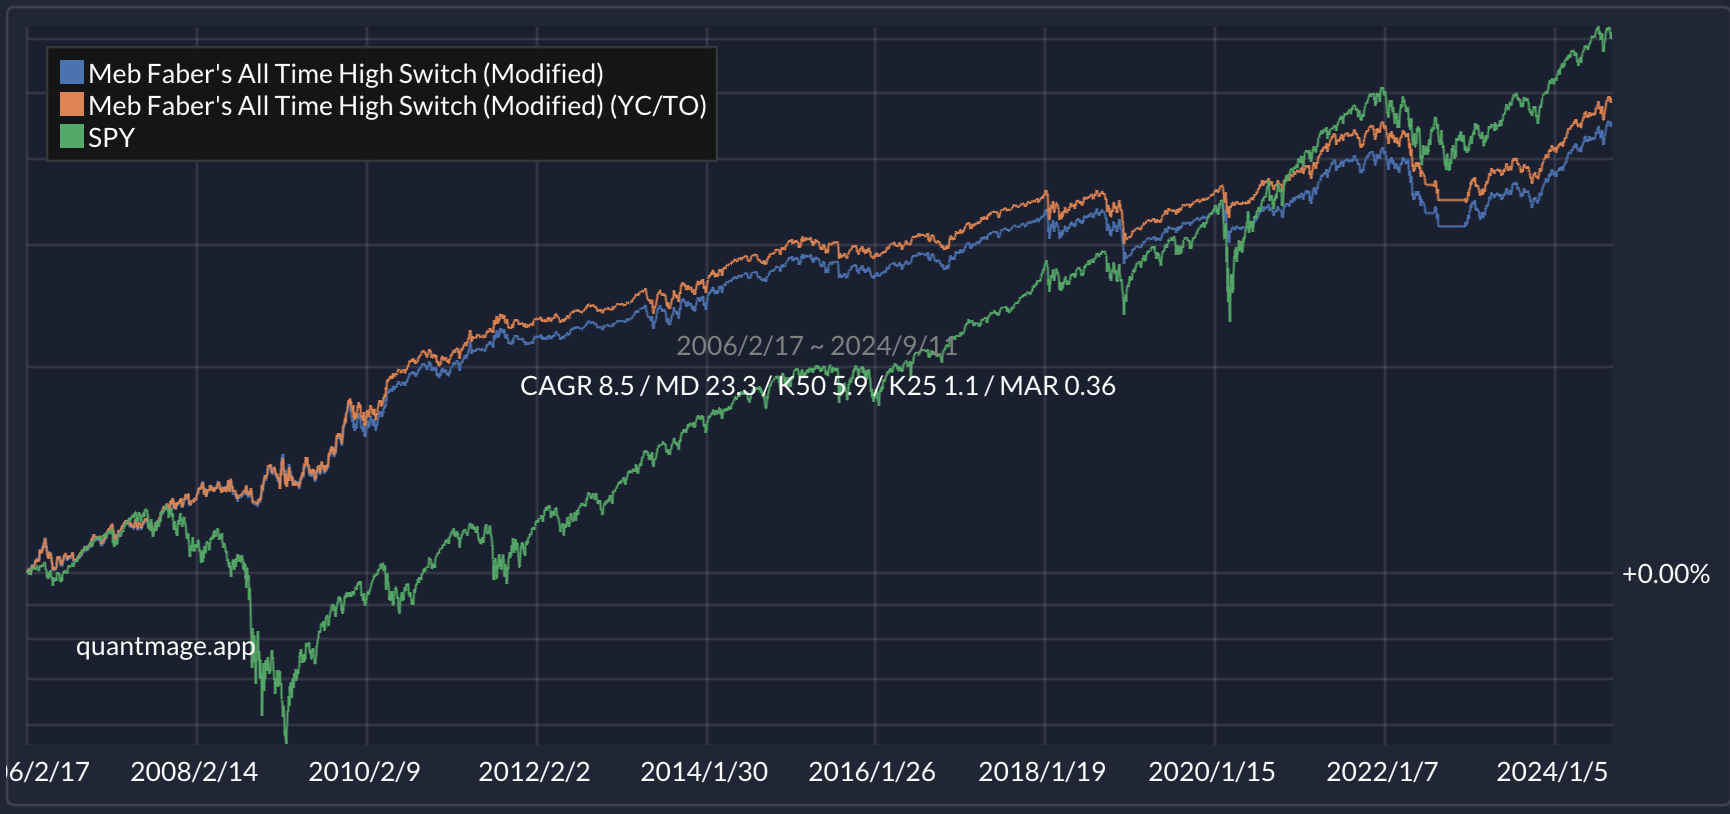
The results? A much-improved CAGR of 8.5% with a max drawdown of 23.3%. Now we’re talking! This return is comparable to SPY, but with significantly lower drawdown and volatility. Note that the period is a bit longer here since we’re not using BIL.
Momentum vs. Mean Reversion
It’s intriguing that a strategy focusing on buying near all-time highs can actually boost performance. This is a classic momentum strategy — striking while the iron is hot. Most tactical approaches boil down to either momentum or mean reversion. Both can work well, according to academic research. The real trick? Figuring out when to use which.
What’s your take? Are you a momenumist or a mean reversionist? I’d love to hear your thoughts! 💭