
How to Measure the Clarity of a Trend
And Some Preliminary Ideas to Utilize It in QuantMage Spells

QuantMage has just rolled out a new indicator that’s unlike anything we’ve had before. While most are momentum indicators based on price deltas, this one—Trend Clarity—measures how strong or clear a trend is. Inspired by an article from Alpha Architect and a paper on the subject, we’re diving into how this works and how it can enhance our investment strategies.
📣 Just a heads-up: The content here is for informational purposes only. It’s not investment advice or a recommendation to buy or sell any stocks. Past performance is not indicative of future results. Always do your own research and consider talking to a financial pro before making any investment moves.
Path Dependency
Take a look at these two price paths from the paper:

Both have the same return over the one-year period shown. Which one shows a clearer trend? Most people would pick A. Trend Clarity helps us understand why such different paths to the same return look so different. Technically it uses linear regression and R-squared (the coefficient of determination), which assesses how well a model's regression line fits the data. One thing worth noting is that this indicator tells us how well the data clusters around the trend line (as a percentage) but doesn’t care about the trend’s direction (whether its’ going up or down.) Now that we have this new tool, let’s explore how it can improve QuantMage strategies.
Leveraging When the Momentum Is Clearer
The first idea I tested was combining Trend Clarity with existing momentum indicators:

Here, the strategy goes risk-on if either SPY’s price is above its 200-day moving average or if the breadth (the percentage of constituent stocks above their 200-day average) is high enough. Otherwise, it switches to cash. For risk-on periods, it further checks SPY’s 180-day Trend Clarity and uses SSO (a 2x levered SPY ETF) if the clarity is above 90%. Does this help?
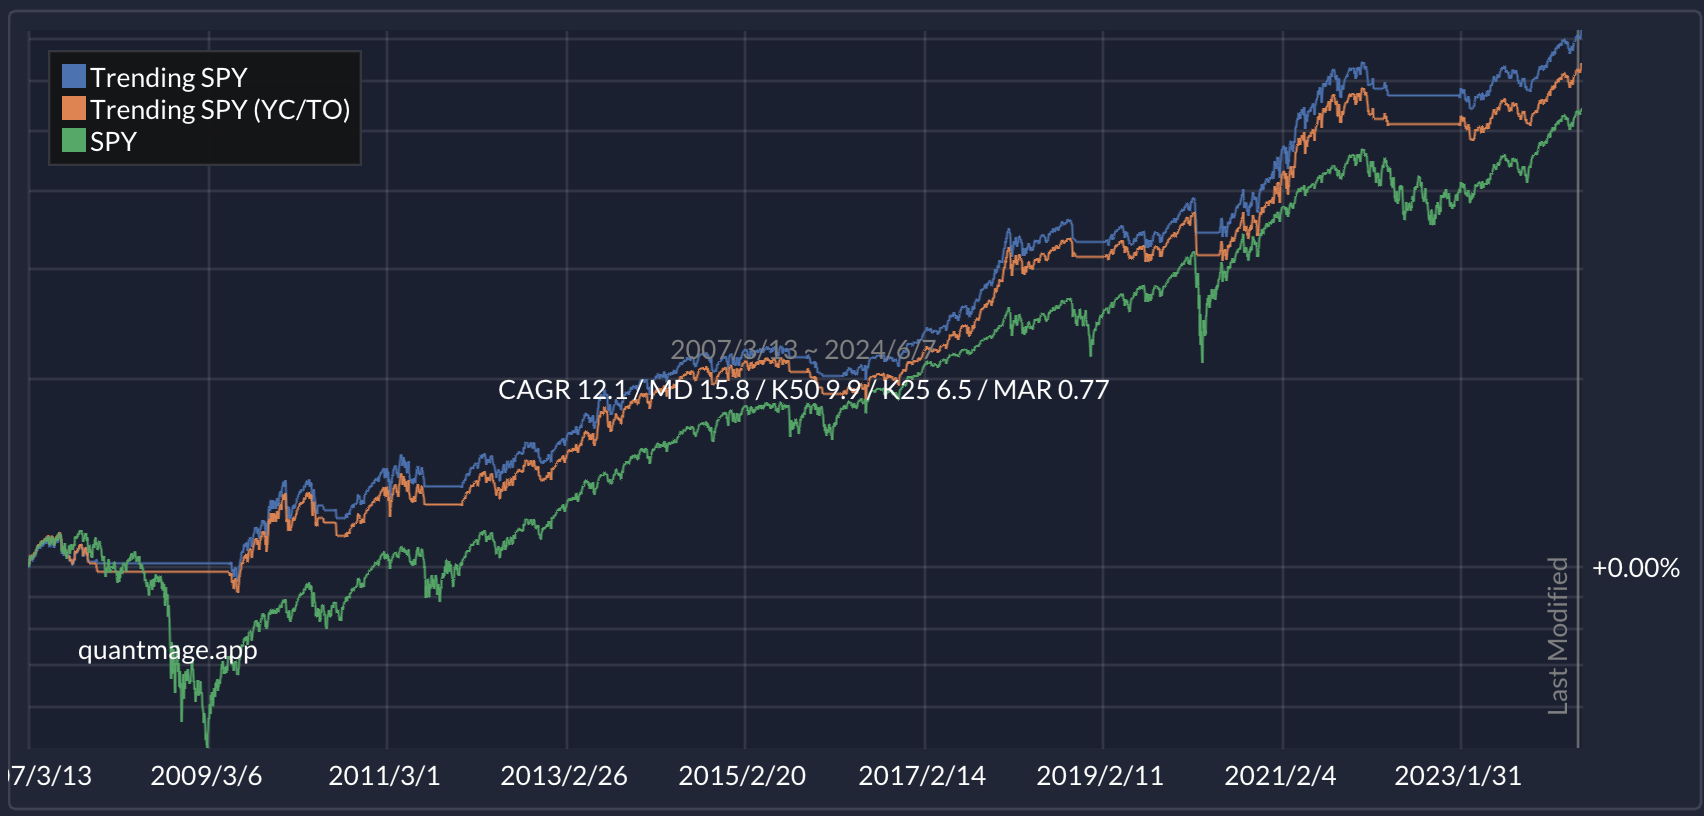
Yes, it does! It outperforms SPY with much lower drawdown and volatility over a 17-year backtest. SSO’s significant return contribution is noteworthy:

SSO contributed 48.1% of the return even though it was only active 12.6% of the time. Try out the strategy here.
Asset Allocation with Clarity Checks
Next, I tinkered with traditional asset allocation strategies:

This strategy rebalances between SPY, QQQ (Nasdaq 100), IWM (Russell 2000), GLD (gold), and XLE (energy sector). The twist is using a Mixed incantation along with Trend Clarity. Each asset is mixed with SHY (short-term bond) according to a relevant Trend Clarity reading to fine-tune risk exposure. The less clear the trend, the more it allocates to the bond.
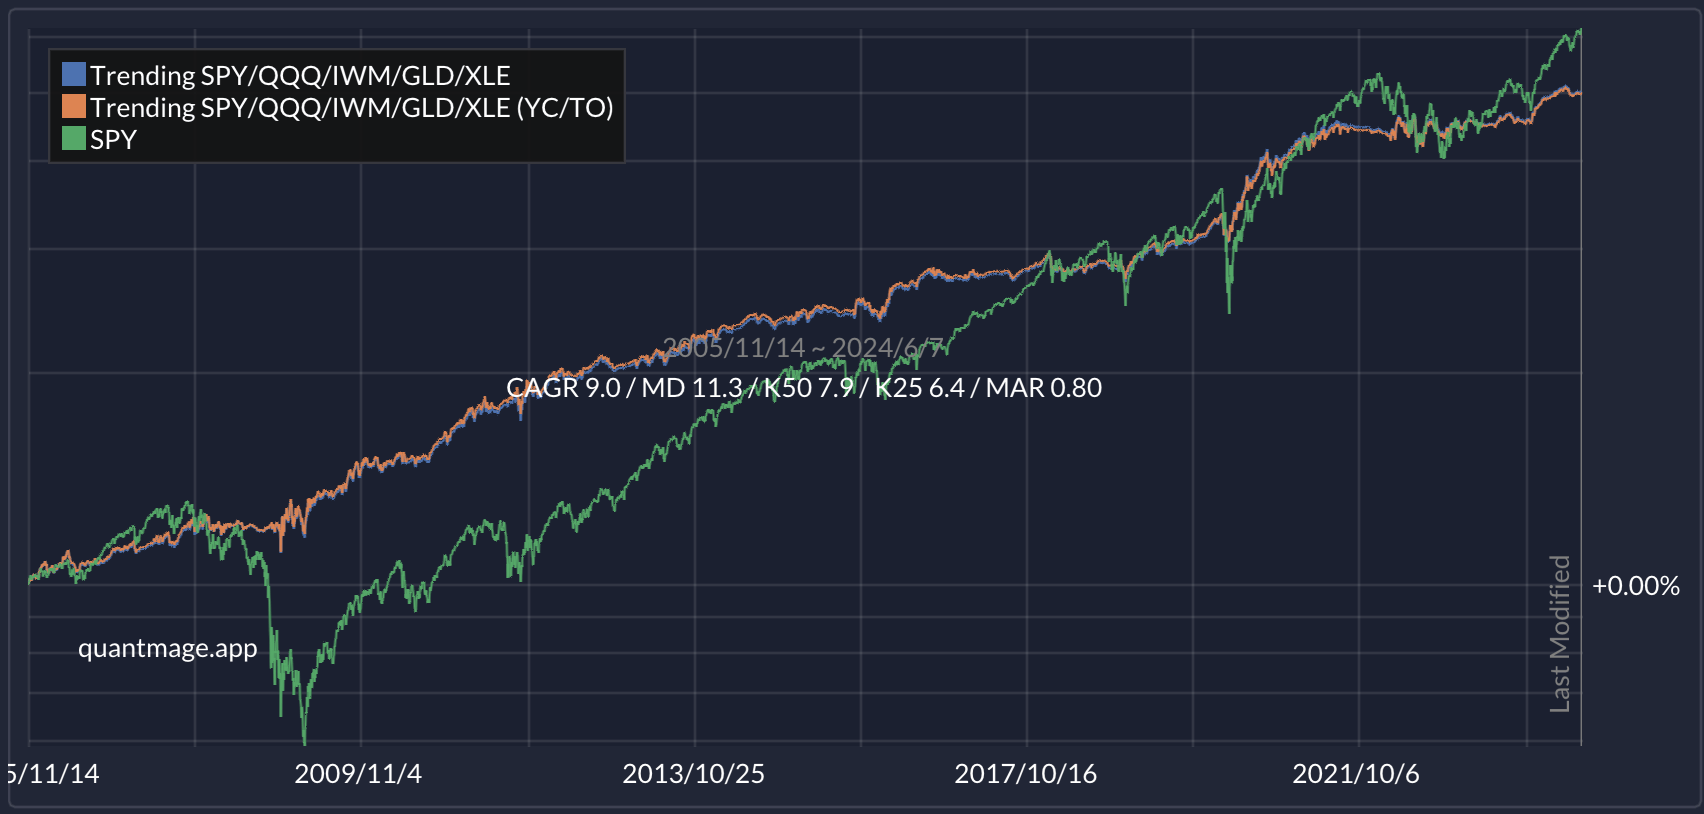

Over a 19-year period, it shows impressive risk-adjusted returns, even though its CAGR is slightly lower than SPY. It handled the 2008 and 2022 drawdowns particularly well:

The distribution stats show that each asset pulled its weight:

You can explore this strategy here. Keep in mind that with 15 tunable parameters (5 assets x 3 for each), some overfitting or data-mining bias might be present. Also, remember that Trend Clarity doesn’t account for the trend’s direction, which makes using it alone risky.
Picking a Trend-Following ETF with the Highest Clarity
What if we apply Trend Clarity to assets with built-in trend-following? Managed Futures ETFs are a good example. Below, the ETF with the highest 250-day clarity is selected among four such ETFs:

This shows decent performance over the last 2.5 years:


A negative correlation (R column in the table above) with SPY is a nice bonus. A low correlation means the asset or strategy can be a great diversifier. However, given the short backtesting history, I have lower confidence in this. Some of the ETFs are relatively new. You can further explore the idea here.
Takeaway
Trend Clarity isn’t the only indicator for measuring trend quality. The paper also mentions another measure called Information Discreteness.
What do you think? Is this a useful addition? I believe I’m still in the early stages of exploring its potential. Can you come up with a better way to use it? Share your thoughts in the comments!
I like some of the ideas. A couple of questions/thoughts:
Wouldn't this be a bit more appropriate using log returns instead of linear returns?
I'm wondering if the multiperiod indicators (e.g., 13612) go a long way towards accounting for the trend clarity.
I'm also wondering how much the relative benefit is when allocations are also dependent on volatility? Presumably volatility would be a surrogate for trend clarity.